
Scientific Journal
Title: Chronic Myeloid Leukemia Following Therapy With Imatinib Mesylate (Gleevec)
Published in the American Journal of Clinical Pathology
Authors: John L. Frater, MD, Martin S. Tallman, MD, Daina Variakojis, MD, Brian J. Druker, MD, Debra Resta, RN, Mary Beth Riley, RN, MSN, OCN, Mary Ann Hrisinko, MT(ASCP), and LoAnn C. Peterson, MD
Link to full article: http://ajcp.ascpjournals.org/content/119/6/833.full.pdf
Summary:
Chronic myeloid (or myelogenous) leukemia is characterized by excessive myeloid proliferation and the Philadelphia chromosome whose product is bcr-abl. Bcr-abl is a gene whose protein product bcr-abl exhibits high tyrosine kinase activity. Imatinib mesylate is a tyrosine kinase inhibitor that binds to abl in leukemia cells and inhibits activity. The purpose of this article was to report specific characteristics of bone marrow in CML patients treated with imatinib mesylate.
This study consisted of 13 adult patients who had interferon-resistant CML in chronic phase and were treated with a 400-mg daily oral dose of imatinib mesylate. The study took place at Northwestern Memorial Hospital in Chicago, Illinois. All patients had evidence of CML and bcr-able before therapy. To examine changes, every three months scientists examines bone marrow by cytogenetic analysis, fluorescence in situ hybridization (FISH), and reverse transcriptase-polymerase chain reaction (RT-PCR).
Before treatment began, leukocyte levels ranged from 8.9-70.9 x 10⁹/L. Decreases in leukocyte counts decreased and remained low for all patients in the first six months. In four patients (1, 6, 9, and 12), leukocyte counts increased as seen in figure 1. By interphase FISH, all patients were positive for the bcr-abl gene before treatment with the mean percent of positive cells being 73%. All patients decreased in the first three months. Patients 1-5 became negative for bcr-abl eventually and stayed that way. In the remaining eight patients, percentages never went below 24%. At 15 months, the mean of this group of patients was 45%, which was lower than the starting point, but none became negative for bcr-abl. This information is displayed in figure 2. Conventional cytogenetic analysis was less accurate but showed similar results. It recorded that patients 1-5 lost all evidence of the Philadelphia chromosome (t(9;22)) but didn’t record variations in the eight remaining patients. Patients 6-13 showed no change or became worse. Bone marrow biopsies were also performed to show cellularity and other details. Before treatment, all patients were hypercellular with cellularity at an average of 95%. For the first group (patients 1-5), cellularity decreased until is reached a nadir (lowest point) at which is started to increase and normalize. However, after the nadir, there was no evidence of CML. Most nadirs occurred at nine months. The other patients (6-13), who remained positive for bcr-abl, all exhibited a decrease in cellularity after treatment, which corresponded to reductions in myeloid proliferation. They were all hypocellular at their nadirs but evidence of CML remained present. Sea-blue histiocytes also became prominent on patents 6-8, 12, and 13, which is common in CML because cell turnover is so rapid.
Overall, analysis after three months of imatinib mesylate therapy revealed decreases histopathological features linked with CML. After three months, however, two groups emerged. Both groups initially responded well to the therapy with a decrease in bone marrow cellularity and FISH fusion signals. Patients who remained negative for bcr-abl returned to morphological features that were normal which persisted until the end of the follow up period. Patients that retained evidence of bcr-abl ultimately regained morphological evidence of CML as cellularity increased following the nadir. These results differed from other studies most likely because there was a longer follow up and FISH data was studied, which is more accurate than conventional methods.
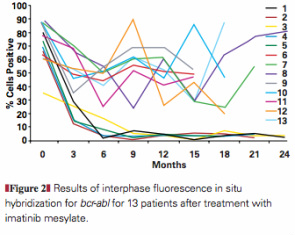
This is figure 2 from page 835 of the article. The figure shows the results of interphase FISH analysis for the 13 patients during imatinib mesylate therapy. It clearly shows the two groups that formed during the study. Patients 1-5 all became negative for bcr-abl (what this was testing for) and patients 6-13 varied but the percent of cells found positive for bcr-abl only decreased by on average about 22%. In the figure, you can see the split between the two groups very clearly. Also, the FISH data shown in this graph was very important for this study and was basically what all the other data was compared to.
